
Help Home > Clustering > The Cluster Details Page
![]()
- Clustering Front Page
- Cluster Details Page
- Phylogenetic Cluster Reconstruction
The Cluster Details Page
The Clustering Details Page allows you to explore the set of genes comprising an individual cluster.
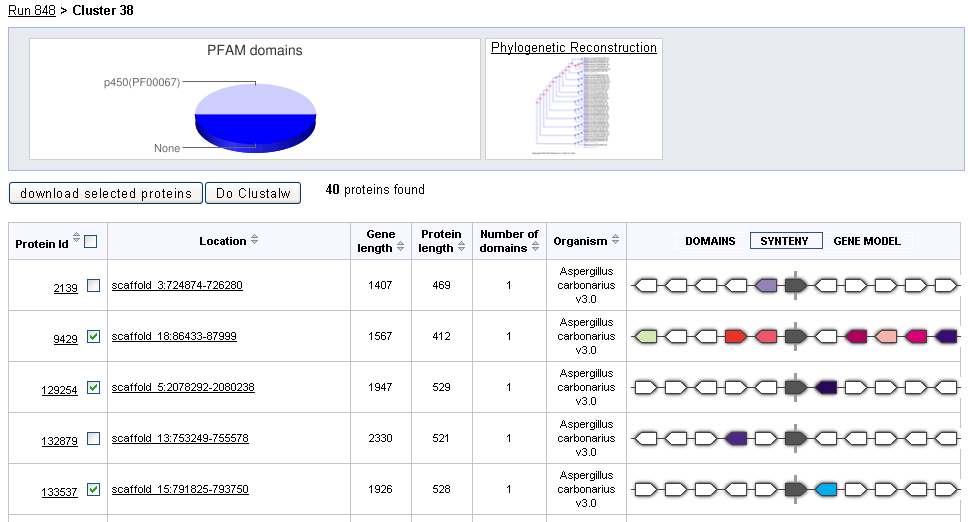
At the top of the page a pie chart shows the distribution of PFAM domains predicted for proteins in the given cluster. If a Phyogenetically reconstructed gene tree is available for this cluster, a link to the tree will appear to the right of the PFAM chart.
Below this, the Run number provides a link back to the previous page listing all of the clusters in this run.
Cluster details are displayed in a table in which each row represents a protein in the cluster. This table has the following columns:
- Protein ID, linked to the protein page for the given gene model.
- Location on the genome, linked to given model in the Genome Browser.
- Length of the gene model
- Length of the translated protein
- Number of PFAM domains.
- Genome containing the gene model
- Ideograms representing domain/synteny/gene model information (described below).
Clicking on any column name will sort the table by the selected column.
Cluster table visualizations
The final column of the cluster details table displays three visualizations used for comparing cluster members:
Domains displays predicted PFAM domains along the protein sequence for each cluster member. Domains that have the same color across cluster members correspond to the same domain assigment. The length of the protein in amino acids is displayed at the right of the diagram.
Synteny displays the gene neighorbood of each member of the cluster. Each colored block represents a predicted gene along the scaffold/chromosome centered on the cluster member, shown in grey. Blocks that have the same color across rows represent gene models that are themselves in the same cluster in the selected run. Blocks that point to the left are on the same strand as the cluster member.
Gene Model displays the predicted intron/exon structure for each member of the cluster. Each exons is shown as a red bar, above which is displayed its bp length. Intron length is displayed in numbers below the gaps between exons.
Getting cluster member information
- In order to download the sequences of members of the cluster, select them using the checkboxes in the ProteinId column of the cluster details table and click download selected proteins. To select or deselect all proteins, check the checkbox next to the ProteinId column title. The download will appear as a single fasta file containing the amino acid sequences of each selected protein.
- Clicking on Do ClustalW will open a second window displaying a multiple alignment of the selected proteins.